PRIME Observation Log 2023/06/26

Return to index
Previous day Next day

Raw Log (Time is in SA time)
Ramp Log (Time is in UT)
CCMain Error Log (Time is in SA time)
Observation Log (Time is in UT)

Date: 2023/06/26
Local observer:
Remote observer:
Weather:
Comment:
Detector Temperature: 0.00000 +- 0.00000 K
ImageAcquisitionErrors occurred 0 times
Expected Time
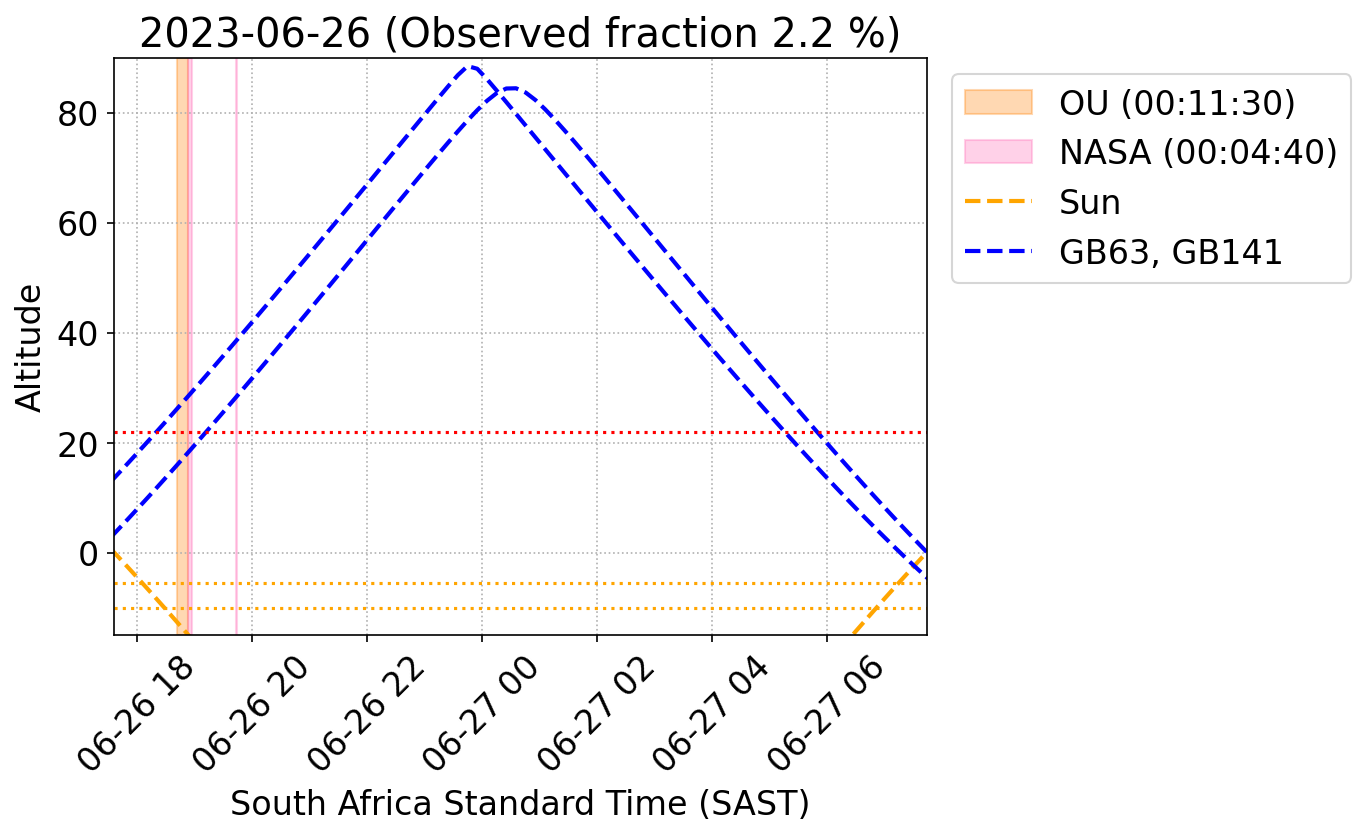
Twilight Flat Time
(Sun altitude = -5.5°)
Evening 18:05:05
Morning 07:14:15
Science Observation
(Sun altitude < -10°)
Start 18:28:13
End 06:51:07
Bulge Observation
(Sun alt. < -10° & GB alt. > 22°)
Start 18:28:13
End 05:49:12


Observed Fraction
Actually Observed Time
(hh:mm:ss)
Expected Observation Time
(hh:mm:ss)
Observed Fraction
(observed/expected)
Total Time 00:16:10 12:22:54 0.022
GB Time 00:00:00 11:20:58 0.000
Non-GB Time 00:16:10 01:01:55 0.261


Institute Statistics
Institute Total Frame Total Exposure
(hh:mm:ss)
Total Observation
(hh:mm:ss)
Efficiency
(exp./obs.)
OU 50 00:02:23 00:11:30 0.207
NASA 74 00:03:31 00:04:40 0.755


Type Statistics
Type Total Frame Total Exposure
(hh:mm:ss)
Total Observation
(hh:mm:ss)
Efficiency
(exp./obs.)
FilterTest 124 00:05:54 00:16:10 0.365


Target Statistics
Target Total Frame Total Exposure
(hh:mm:ss)
Total Observation
(hh:mm:ss)
Efficiency
(exp./obs.)
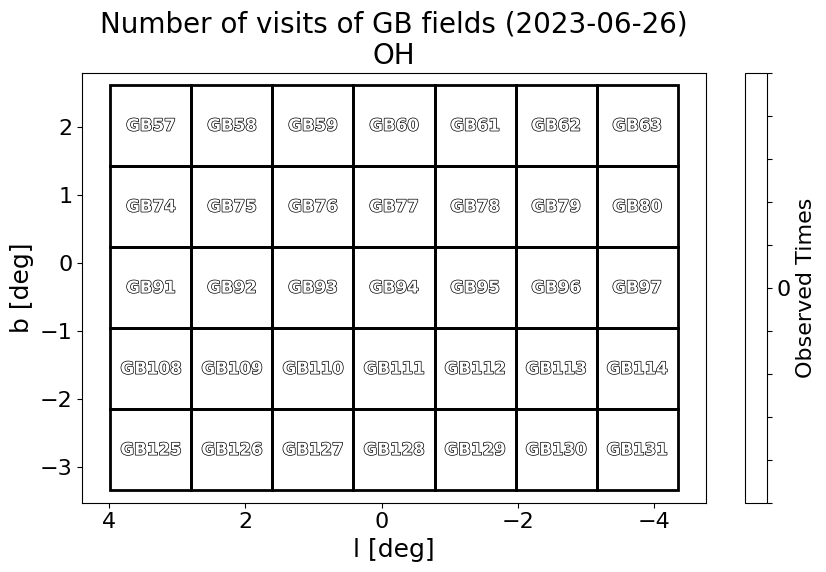
OH 4 00:00:11 00:00:50 0.225
OY 4 00:00:11 00:00:47 0.239
OJ 4 00:00:11 00:00:59 0.193
OO 2 00:00:05 00:00:42 0.135
ZO 4 00:00:11 00:00:45 0.253
ZH 4 00:00:11 00:00:50 0.225
ZY 4 00:00:11 00:00:47 0.239
ZJ 4 00:00:11 00:01:10 0.163
NBO 4 00:00:11 00:00:45 0.253
NBH 4 00:00:11 00:00:50 0.225
NBY 4 00:00:11 00:00:47 0.239
NBJ 4 00:00:11 00:01:07 0.169
DO 4 00:00:11 00:01:04 0.177
DY 74 00:03:31 00:04:40 0.755


Stats so far in 2023
Monthly observed fraction so far in 2023
Month Observed Time
(hh:mm:ss)
Expected Time
(hh:mm:ss)
Observed Fraction
(observed/expected)
Jan 18:43:03 259:20:03 0.072
Feb 51:45:11 258:50:12 0.200
Mar 55:18:59 318:34:15 0.174
Apr 77:47:40 337:41:57 0.230
May 97:43:38 372:13:44 0.263
Jun 41:17:48 321:18:22 0.129

Observed time so far in 2023
- Total time of each institute is calculated by the following
    [All observation time in 2023] = [Observed time so far] + [Remaining time in the future]
    [Remaining time in the future] = [Clear sky fraction] x [Remaining night time (Sun alt. < -10°)]
    
    [GB observation time in 2023] = [Observed GB time so far] + [Remaining GB time in the future]
    [Remaining GB time in the future] = [Clear sky fraction] x [Remaining GB night time (Sun alt. < -10° & GB alt. > 22°)]
    
    [Non-GB observation time in 2023] = [All observation time in 2023] - [GB observation time in 2023]
    
    [OU, NASA, ABC time in 2023] = 0.24 x [Non-GB observation time in 2023]
    [SAAO time in 2023] = 0.28 x [Non-GB observation time in 2023]
    
- ALLSKY time is equally distributed to each institute
- ToO time is distributed to each institute based on input of observer of each date
- Clear sky fraction of (0.5, 0.5, 0.5, 0.5, 0.5, 0.5, 0.5, 0.5, 0.5, 0.5, 0.5, 0.5) is assumed for (Jan, ..., Dec) in the calculation of the remaining observation time
All
(hh:mm:ss)
GB
(hh:mm:ss)
Non-GB
(hh:mm:ss)
SAAO
(hh:mm:ss)
OU
(hh:mm:ss)
NASA
(hh:mm:ss)
ABC
(hh:mm:ss)
CALIB
(hh:mm:ss)
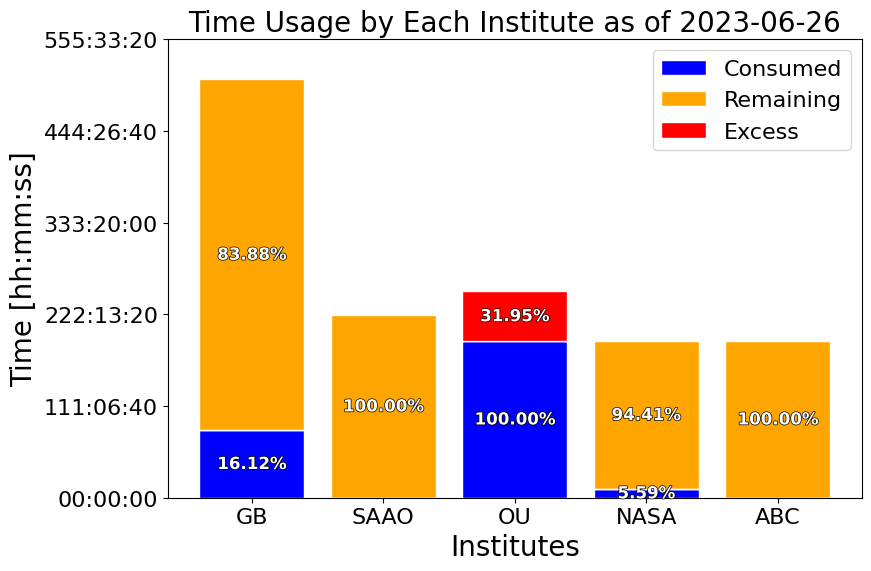
Total 1297:31:36 507:19:47 790:11:48 221:15:18 189:38:50 189:38:50 189:38:50 15:42:12
Observed 342:36:22
(26.40%)
81:45:44
(16.12%)
260:50:38
(33.01%)
00:00:00
(0.00%)
250:14:46
(131.95%)
10:35:51
(5.59%)
00:00:00
(0.00%)
15:42:12
(N/A)
Remaining 954:55:13
(73.60%)
425:34:03
(83.88%)
529:21:10
(66.99%)
221:15:18
(100.00%)
-61:24:04
(0.00%)
179:02:58
(94.41%)
189:38:50
(100.00%)
00:00:00
(N/A)


Camera status (2023/06/26)