PRIME Observation Log 2023/10/10

Return to index
Previous day Next day

Raw Log (Time is in SA time)
Ramp Log (Time is in UT)
CCMain Error Log (Time is in SA time)
Observation Log (Time is in UT)
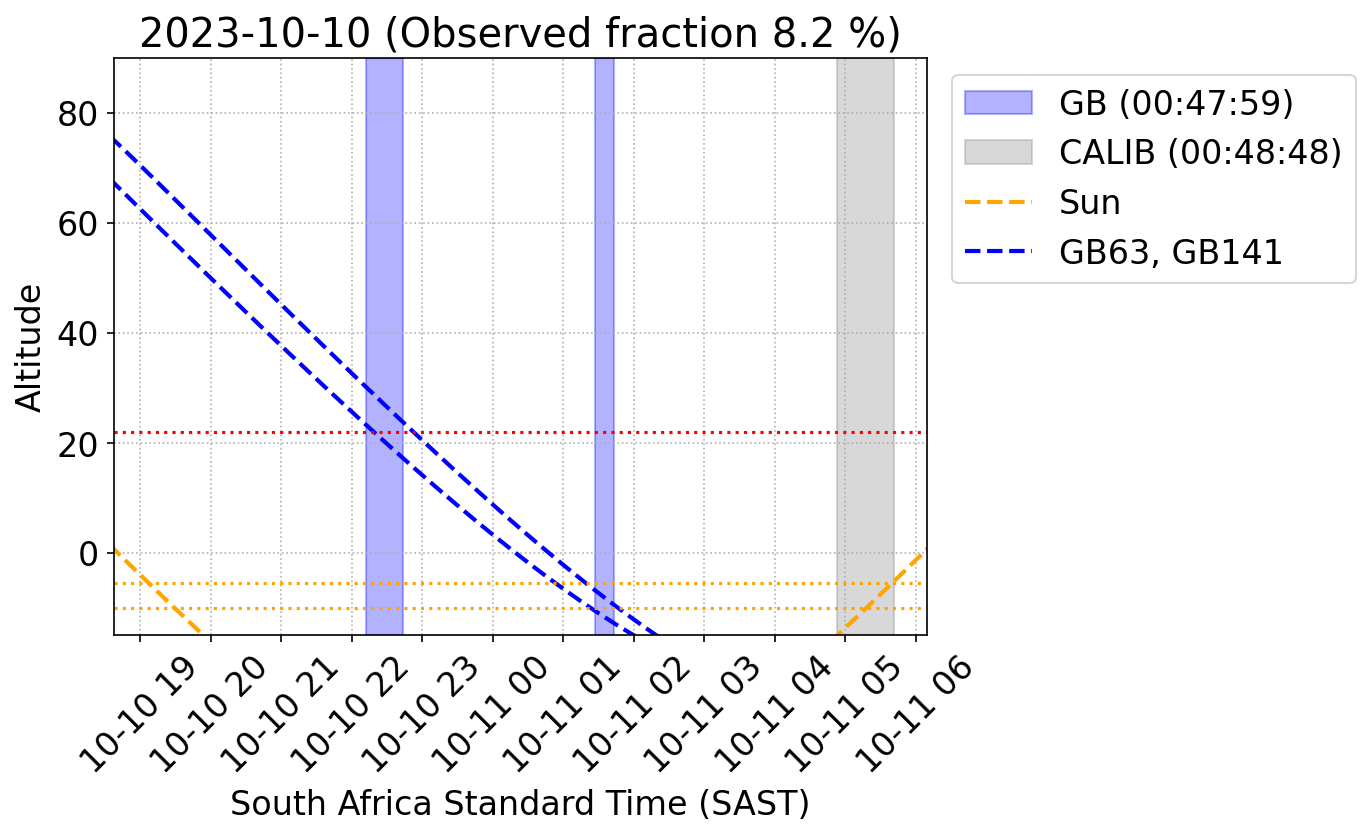
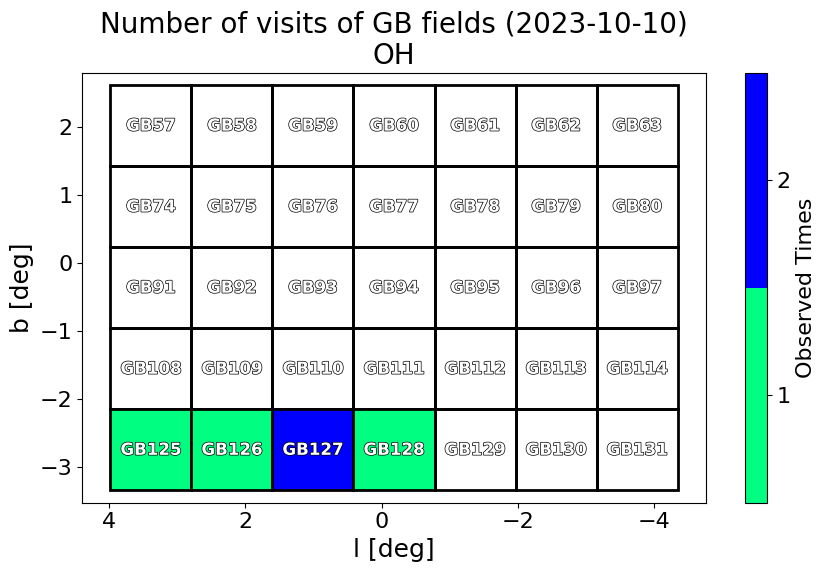
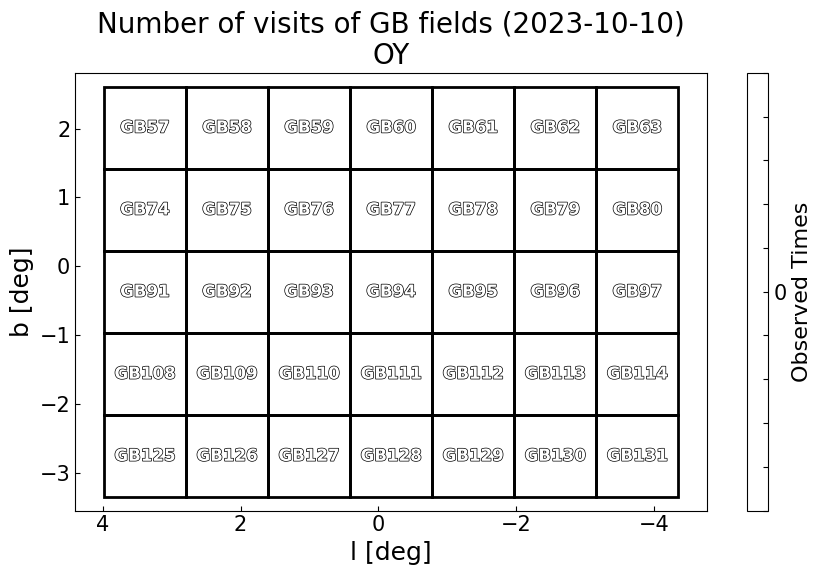
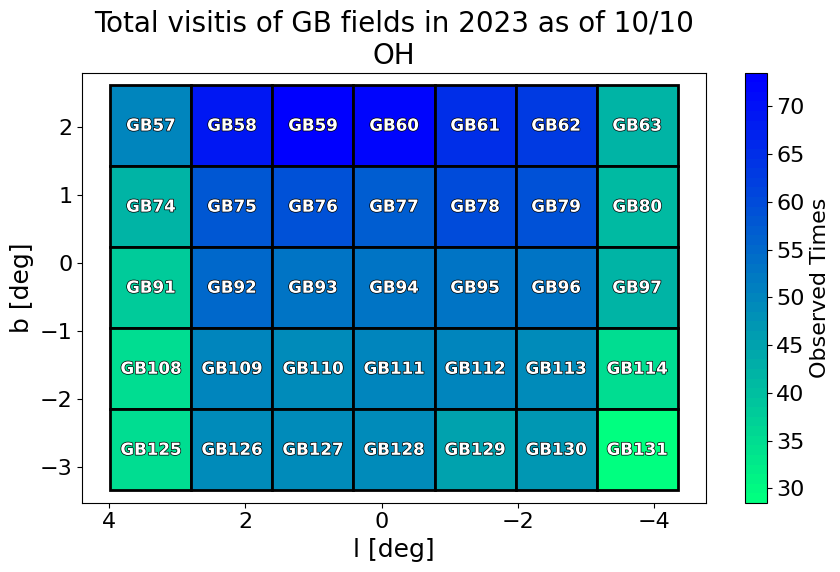
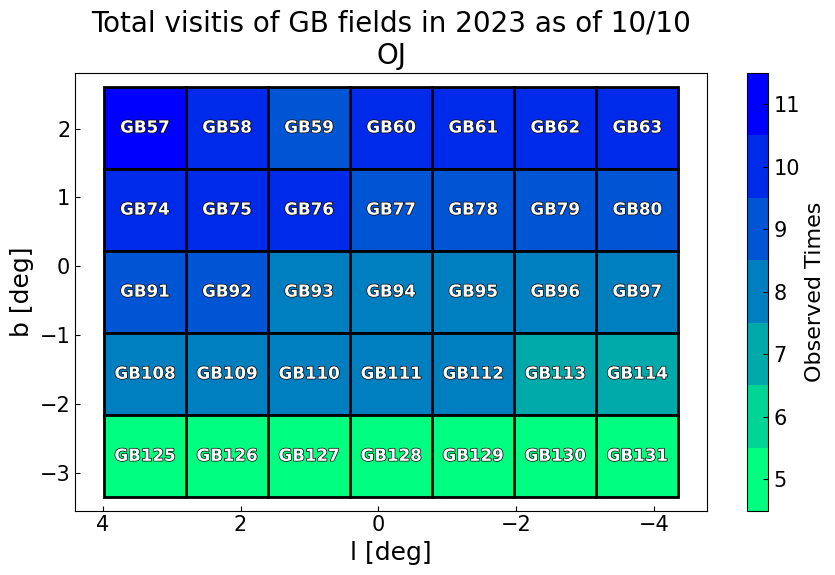
Date: 2023/10/10
Local observer:
Remote observer:
Weather:
Comment:
Detector Temperature: 0.00000 +- 0.00000 K
ImageAcquisitionErrors occurred 4 times @
2023-10-10 22:01:49 SAT
2023-10-10 22:02:35 SAT
2023-10-10 22:09:53 SAT
2023-10-10 22:11:25 SAT

Expected Time
Twilight Flat Time
(Sun altitude = -5.5°)
Evening 19:07:20
Morning 05:39:36
Science Observation
(Sun altitude < -10°)
Start 19:29:14
End 05:17:43
Bulge Observation
(Sun alt. < -10° & GB alt. > 22°)
Start 19:29:14
End 22:52:24


Observed Fraction
Actually Observed Time
(hh:mm:ss)
Expected Observation Time
(hh:mm:ss)
Observed Fraction
(observed/expected)
Total Time 00:47:59 09:48:29 0.082
GB Time 00:47:59 03:23:10 0.236
Non-GB Time 00:00:00 06:25:18 0.000


Institute Statistics
Institute Total Frame Total Exposure
(hh:mm:ss)
Total Observation
(hh:mm:ss)
Efficiency
(exp./obs.)
GB 260 00:12:23 00:47:59 0.258
CALIB 528 00:25:10 00:48:48 0.516


Type Statistics
Type Total Frame Total Exposure
(hh:mm:ss)
Total Observation
(hh:mm:ss)
Efficiency
(exp./obs.)
Bulge 260 00:12:23 00:47:59 0.258
TWILIGHT 528 00:25:10 00:48:48 0.516


Target Statistics
Target Total Frame Total Exposure
(hh:mm:ss)
Total Observation
(hh:mm:ss)
Efficiency
(exp./obs.)
GB125_TEST OH 20 00:00:57 00:11:45 0.081
GB125 OH 48 00:02:17 00:04:07 0.555
GB126 OH 48 00:02:17 00:04:07 0.554
GB127 OH 76 00:03:37 00:07:17 0.497
GB128 OH 52 00:02:28 00:07:48 0.318
GB128 OJ 16 00:00:45 00:12:53 0.059
FLAT OY 528 00:25:10 00:48:48 0.516


Stats so far in 2023
Monthly observed fraction so far in 2023
Month Observed Time
(hh:mm:ss)
Expected Time
(hh:mm:ss)
Observed Fraction
(observed/expected)
Jan 18:43:03 259:20:03 0.072
Feb 51:45:11 258:50:12 0.200
Mar 55:18:59 318:34:15 0.174
Apr 77:47:40 337:41:57 0.230
May 97:43:38 372:13:44 0.263
Jun 49:38:22 370:47:30 0.134
Jul 188:52:24 377:38:54 0.500
Aug 166:19:41 357:47:22 0.465
Sep 168:01:16 319:07:11 0.527
Oct 35:40:50 99:39:02 0.358

Observed time so far in 2023
- Total time of each institute is calculated by the following
    [All observation time in 2023] = [Observed time so far] + [Remaining time in the future]
    [Remaining time in the future] = [Clear sky fraction] x [Remaining night time (Sun alt. < -10°)]
    
    [GB observation time in 2023] = [Observed GB time so far] + [Remaining GB time in the future]
    [Remaining GB time in the future] = [Clear sky fraction] x [Remaining GB night time (Sun alt. < -10° & GB alt. > 22°)]
    
    [Non-GB observation time in 2023] = [All observation time in 2023] - [GB observation time in 2023]
    
    [OU, NASA, ABC time in 2023] = 0.24 x [Non-GB observation time in 2023]
    [SAAO time in 2023] = 0.28 x [Non-GB observation time in 2023]
    
- ALLSKY time is equally distributed to each institute
- ToO time is distributed to each institute based on input of observer of each date
- Clear sky fraction of (0.5, 0.5, 0.5, 0.5, 0.5, 0.5, 0.5, 0.5, 0.5, 0.5, 0.5, 0.5) is assumed for (Jan, ..., Dec) in the calculation of the remaining observation time
All
(hh:mm:ss)
GB
(hh:mm:ss)
Non-GB
(hh:mm:ss)
SAAO
(hh:mm:ss)
OU
(hh:mm:ss)
NASA
(hh:mm:ss)
ABC
(hh:mm:ss)
CALIB
(hh:mm:ss)
Total 1262:55:35 306:13:34 956:42:01 267:52:34 229:36:29 229:36:29 229:36:29 19:07:48
Observed 909:51:11
(72.04%)
271:31:55
(88.67%)
638:19:15
(66.72%)
00:00:00
(0.00%)
627:33:53
(273.32%)
10:45:22
(4.68%)
00:00:00
(0.00%)
19:07:48
(N/A)
Remaining 353:04:24
(27.96%)
34:41:38
(11.33%)
318:22:45
(33.28%)
267:52:34
(100.00%)
-398:02:36
(0.00%)
218:51:06
(95.32%)
229:36:29
(100.00%)
00:00:00
(N/A)


Camera status (2023/10/10)