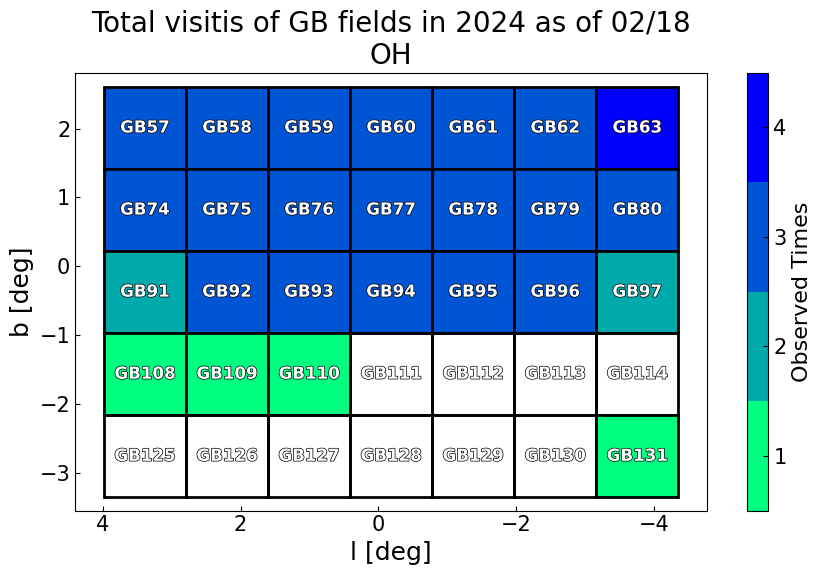
PRIME Observation Log 2024/02/18

Return to index
Previous day Next day

Raw Log (Time is in SA time)
Ramp Log (Time is in UT)
CCMain Error Log (Time is in SA time)
Observation Log (Time is in UT)

Date: 2024/02/18
Local observer:
Remote observer:
Weather:
Comment:
Detector Temperature: 0.00000 +- 0.00000 K
ImageAcquisitionErrors occurred 0 times
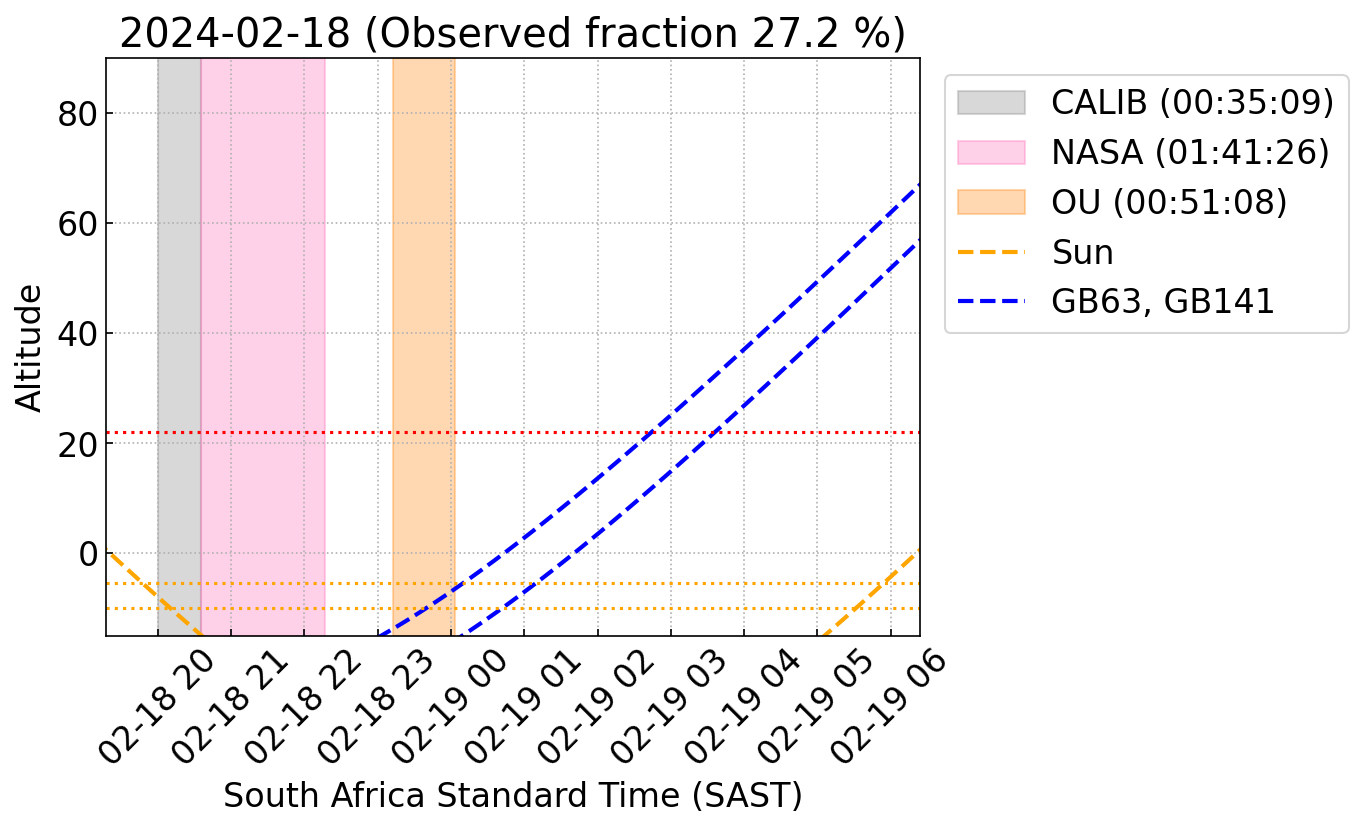
Expected Time
Twilight Flat Time
(Sun altitude = -5.5°)
Evening 19:47:41
Morning 05:54:01
Science Observation
(Sun altitude < -10°)
Start 20:10:13
End 05:31:28
Bulge Observation
(Sun alt. < -10° & GB alt. > 22°)
Start 02:44:08
End 05:31:28


Observed Fraction
Actually Observed Time
(hh:mm:ss)
Expected Observation Time
(hh:mm:ss)
Observed Fraction
(observed/expected)
Total Time 02:32:35 09:21:14 0.272
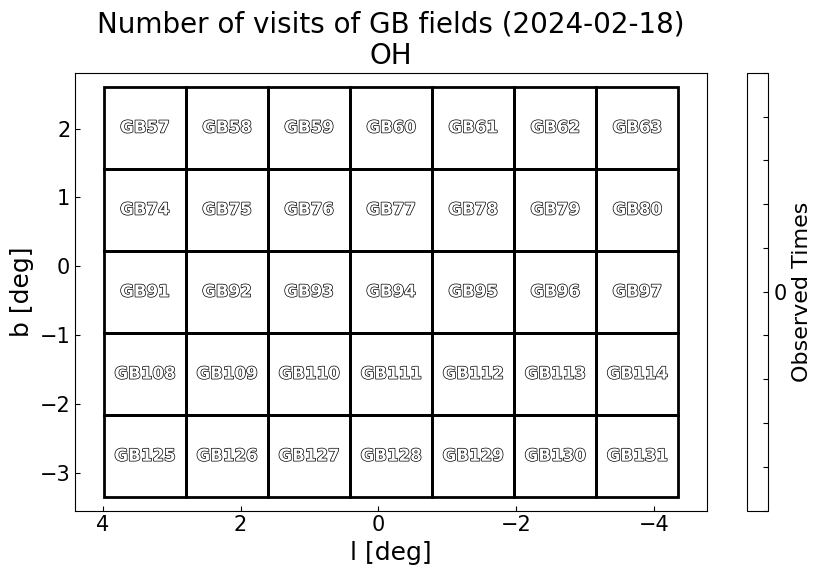
GB Time 00:00:00 02:47:20 0.000
Non-GB Time 02:32:35 06:33:54 0.387


Institute Statistics
Institute Total Frame Total Exposure
(hh:mm:ss)
Total Observation
(hh:mm:ss)
Efficiency
(exp./obs.)
CALIB 240 00:11:26 00:35:09 0.325
NASA 900 00:42:54 01:41:26 0.423
OU 80 00:03:48 00:51:08 0.075


Type Statistics
Type Total Frame Total Exposure
(hh:mm:ss)
Total Observation
(hh:mm:ss)
Efficiency
(exp./obs.)
EVENING_TWILIGHT 240 00:11:26 00:35:09 0.325
all_sky_grid 900 00:42:54 01:41:26 0.423
tel_analysys 80 00:03:48 00:51:08 0.075


Target Statistics
Target Total Frame Total Exposure
(hh:mm:ss)
Total Observation
(hh:mm:ss)
Efficiency
(exp./obs.)
FLAT 240 00:11:26 00:35:09 0.325
field21685_test 180 00:08:34 00:46:02 0.186
field21685 720 00:34:19 00:55:24 0.619
1 16 00:00:45 00:20:31 0.037
2 4 00:00:11 00:01:52 0.102
3 4 00:00:11 00:03:52 0.049
4 4 00:00:11 00:01:18 0.145
5 4 00:00:11 00:01:13 0.156
6 4 00:00:11 00:01:35 0.120
7 4 00:00:11 00:02:03 0.093
8 4 00:00:11 00:01:52 0.102
9 4 00:00:11 00:02:17 0.083
10 4 00:00:11 00:02:12 0.087
11 4 00:00:11 00:01:32 0.123
12 4 00:00:11 00:02:00 0.095
13 4 00:00:11 00:02:03 0.093
14 4 00:00:11 00:02:56 0.065
15 4 00:00:11 00:00:59 0.193
16 4 00:00:11 00:02:03 0.093
17 4 00:00:11 00:00:41 0.276


Stats so far in 2024
Monthly observed fraction so far in 2024
Month Observed Time
(hh:mm:ss)
Expected Time
(hh:mm:ss)
Observed Fraction
(observed/expected)
Jan 133:42:32 259:10:04 0.516
Feb 67:57:50 163:07:08 0.417

Observed time so far in 2024
- Total time of each institute is calculated by the following
    [All observation time in 2024] = [Observed time so far] + [Remaining time in the future]
    [Remaining time in the future] = [Clear sky fraction] x [Remaining night time (Sun alt. < -10°)]
    
    [GB observation time in 2024] = [Observed GB time so far] + [Remaining GB time in the future]
    [Remaining GB time in the future] = [Clear sky fraction] x [Remaining GB night time (Sun alt. < -10° & GB alt. > 22°)]
    
    [Non-GB observation time in 2024] = [All observation time in 2024] - [GB observation time in 2024]
    
    [OU, NASA, ABC time in 2024] = 0.24 x [Non-GB observation time in 2024]
    [SAAO time in 2024] = 0.28 x [Non-GB observation time in 2024]
    
- ALLSKY time is equally distributed to each institute
- ToO time is distributed to each institute based on input of observer of each date
- Clear sky fraction of (0.5, 0.5, 0.5, 0.5, 0.5, 0.5, 0.5, 0.5, 0.5, 0.5, 0.5, 0.5) is assumed for (Jan, ..., Dec) in the calculation of the remaining observation time
All
(hh:mm:ss)
GB
(hh:mm:ss)
Non-GB
(hh:mm:ss)
SAAO
(hh:mm:ss)
OU
(hh:mm:ss)
NASA
(hh:mm:ss)
ABC
(hh:mm:ss)
CALIB
(hh:mm:ss)
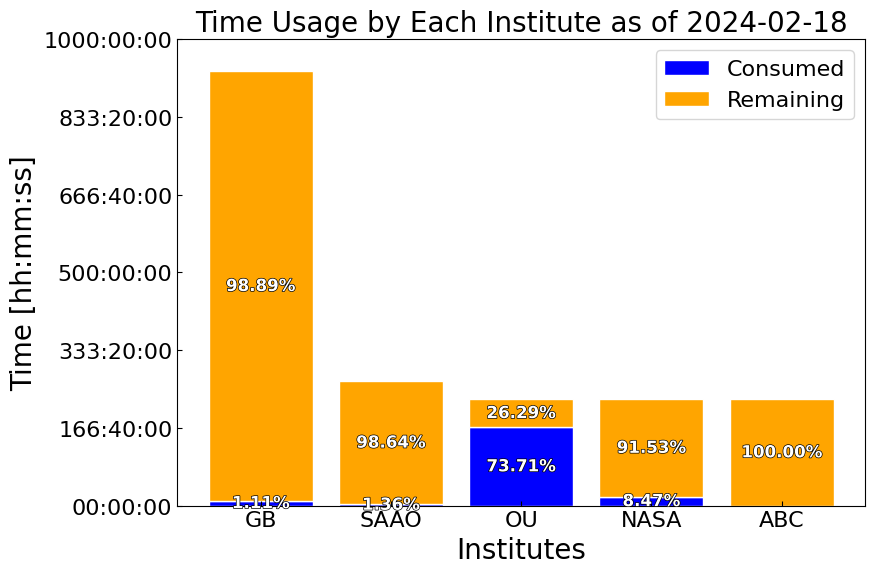
Total 1883:28:41 931:44:26 951:44:14 266:29:11 228:25:01 228:25:01 228:25:01 30:20:48
Observed 201:40:22
(10.71%)
10:19:14
(1.11%)
191:21:08
(20.11%)
03:37:34
(1.36%)
168:22:20
(73.71%)
19:21:14
(8.47%)
00:00:00
(0.00%)
30:20:48
(N/A)
Remaining 1681:48:18
(89.29%)
921:25:12
(98.89%)
760:23:05
(79.89%)
262:51:36
(98.64%)
60:02:41
(26.29%)
209:03:47
(91.53%)
228:25:01
(100.00%)
00:00:00
(N/A)


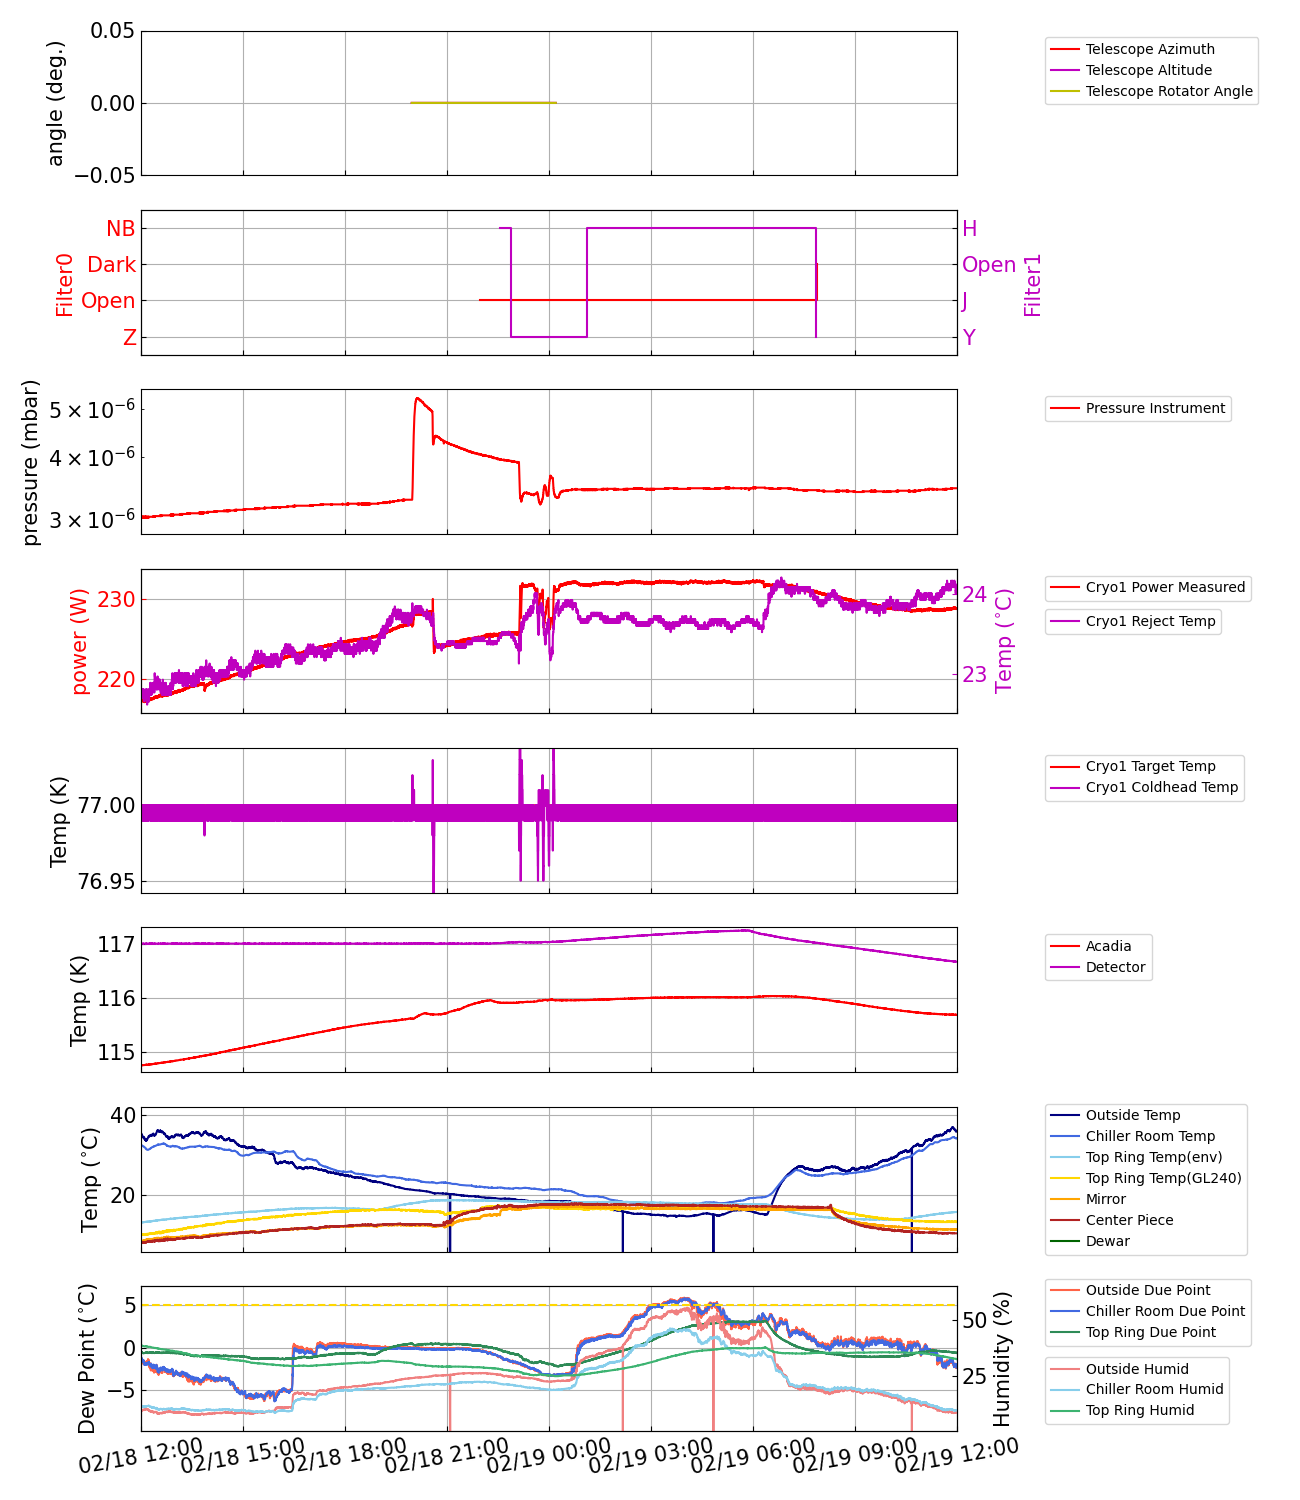
Camera status (2024/02/18)


Return to index
Previous day Next day